- Home
- Blog
- Moviegoer experience
- Impact of Streaming on Cinema Attendance: 25 Years of Data
Impact of Streaming on Cinema Attendance: 25 Years of Data
The impact of streaming on cinema attendance: US tickets fell from 1.57bn in 2002 to 769m last year. Windows, studies, Europe and what cinemas can do.
The impact of streaming on cinema attendance is real but smaller, and slower, than the headlines suggest. US cinemas sold about 1.57 billion tickets in 2002 and 1.23 billion in 2019, a gradual 22% decline over 17 years in which Netflix went from a DVD-by-post company to 167 million paying members (The Numbers). The sharp break came in 2020, when cinemas closed. Since then US attendance has settled at around 760 to 770 million tickets a year, roughly 63% of 2019. The main way streaming has hurt cinemas is not by stealing the audience outright but by shortening the exclusive theatrical window, from more than 100 days in 2012 to an average of 37 days for the top 100 films in 2025 (Cinema United).
Below are the cinema attendance statistics behind that answer, the window deals and day-and-date experiments, what research says about cause and effect, how Europe and Asia compare, and what an exhibitor can do. It is written for cinema owners and managers.
The impact of streaming on cinema attendance in numbers
| Measure | Figure | Year | Source |
|---|---|---|---|
| US tickets sold, peak | 1.57 billion | 2002 | The Numbers |
| US tickets sold, last pre-pandemic year | 1.23 billion | 2019 | The Numbers |
| US tickets sold, latest full year | 769 million (63% of 2019) | 2025 | The Numbers |
| US and Canada box office | $8.66bn (76% of 2019's $11.36bn) | 2025 | Box Office Mojo |
| Average US ticket price | $11.31 (up from $9.16 in 2019) | 2025 | The Numbers |
| Netflix paid memberships, worldwide | 301.6 million | end of 2024 | Netflix 10-K |
| Netflix paid memberships, US and Canada | 89.6 million | end of 2024 | Netflix 10-K |
| Average exclusive window, top 100 films | 37 days | 2025 | Cinema United |
| European admissions (39 territories) | 863.6 million (about 64% of 2019) | 2025 | UNIC |
| IMAX global box office | $1.28bn, a record, 13% above 2019 | 2025 | IMAX |
Two things stand out. Revenue has recovered further than attendance, because the average ticket costs 23% more than in 2019. And premium formats have recovered completely, while the ordinary weekday screening has not. Both matter more to a cinema's plan than the national total.
Cinema attendance statistics: the decline in movie theater attendance, 2000 to 2025
US attendance peaked at 1.57 billion tickets in 2002 and then drifted. Between 2003 and 2019 it moved in a band of roughly 1.23 to 1.53 billion, with good years driven by the slate (2009 had Avatar, 2018 had Avengers: Infinity War and Black Panther). The full year-by-year table, with average ticket prices, is on our US movie theater attendance page.
Show the data as a table
| Year | Tickets sold (millions) |
|---|---|
| 2000 | 1,402m |
| 2001 | 1,437m |
| 2002 | 1,570m |
| 2003 | 1,529m |
| 2004 | 1,512m |
| 2005 | 1,377m |
| 2006 | 1,406m |
| 2007 | 1,406m |
| 2008 | 1,360m |
| 2009 | 1,418m |
| 2010 | 1,327m |
| 2011 | 1,285m |
| 2012 | 1,354m |
| 2013 | 1,345m |
| 2014 | 1,279m |
| 2015 | 1,333m |
| 2016 | 1,317m |
| 2017 | 1,231m |
| 2018 | 1,300m |
| 2019 | 1,230m |
| 2020 | 232m |
| 2021 | 444m |
| 2022 | 702m |
| 2023 | 819m |
| 2024 | 761m |
| 2025 | 769m |
Declining movie theater attendance in the US therefore has two parts with different causes:
- 2002 to 2019: a slow slide of about 22%. Streaming was one pressure among several. Ticket prices rose from $5.81 to $9.16 over the same period (The Numbers), DVD and then digital rental took share, and the number of films released in cinemas kept rising, spreading the audience thinner.
- 2020 onwards: a step down of about 37%. Attendance fell to 232 million in 2020, rebounded to 819 million in 2023 and has stayed in the 760 to 770 million range since. The habit that was broken in 2020 has only partly come back.
| Year | US tickets sold | Average ticket | US and Canada box office |
|---|---|---|---|
| 2002 | 1,570m | $5.81 | n/a in this series |
| 2012 | 1,354m | $7.96 | $10.84bn |
| 2019 | 1,230m | $9.16 | $11.36bn |
| 2020 | 232m | $9.18 | $2.11bn |
| 2023 | 819m | $10.94 | $8.91bn |
| 2024 | 761m | $11.31 | $8.57bn |
| 2025 | 769m | $11.31 | $8.66bn |
Tickets and prices: The Numbers (archived January 2026; it revises past years). Box office: Box Office Mojo, release-year domestic gross, nominal dollars.
Note what the table does not show: a smooth line from Netflix's growth to empty seats. Attendance in 2018, when Netflix already had 139 million members, was higher than in 2014. If streaming alone were draining cinemas, the pre-2020 decline would have accelerated as streaming scaled. It did not.
Streaming services are growing fast: Netflix memberships against tickets sold
For a cinema vs streaming comparison, Netflix is the cleanest long series, because it reported paid memberships in its annual reports until the end of 2024. It ended 2013 with 41.4 million paid streaming members worldwide (10-K), 167.1 million at the end of 2019 (10-K) and 301.6 million at the end of 2024 (10-K). It stopped reporting member counts from the first quarter of 2025 (as announced in April 2024). Its 2025 streaming revenue was $45.2bn (10-K), more than Gower Street's estimate of $33.6bn for the entire world's box office that year (Gower Street).
Show the data as a table
| Year | US tickets sold | Netflix paid memberships (worldwide) |
|---|---|---|
| 2013 | 1,345 | 41.4 |
| 2014 | 1,279 | 54.5 |
| 2015 | 1,333 | 70.8 |
| 2016 | 1,317 | 89.1 |
| 2017 | 1,231 | 110.6 |
| 2018 | 1,300 | 139.3 |
| 2019 | 1,230 | 167.1 |
| 2020 | 232 | 203.7 |
| 2021 | 444 | 221.8 |
| 2022 | 702 | 230.7 |
| 2023 | 819 | 260.3 |
| 2024 | 761 | 301.6 |
Over 2013 to 2019 Netflix's membership grew about fourfold. US tickets sold fell 8.6% in the same years (1,345 million to 1,230 million). In the US alone, Netflix had 31.7 million paid streaming members in 2013 (10-K) and 67.7 million across the US and Canada in 2019 (10-K). Streaming clearly took a share of evening entertainment time. But the numbers do not support the idea, repeated in many articles, that each new subscriber was a lost moviegoer.
A fair reading is that streaming changed the kind of film people go out for. Mid-budget dramas, comedies and adult thrillers, which used to fill screens on ordinary weeknights, moved to streaming services as originals or arrived at home within weeks. Franchise, animation, horror and event films stayed theatrical. That shift shows up in fewer, bigger releases: Box Office Mojo counted 910 releases in US and Canadian cinemas in 2019 and 670 in 2025 (Box Office Mojo). See our cinema industry statistics for the release-count series.
Theatrical windows: from more than 100 days to about 37
The theatrical window is the period a film plays only in cinemas before it can be bought, rented or streamed at home. It is the main lever through which streaming affects cinema attendance, because a customer who knows a film will be at home in a month has less reason to go this weekend.
Show the data as a table
| Period or deal | Days |
|---|---|
| 2012 average (NATO) | 112 days |
| 2017 average (NATO) | 85 days |
| 2020 Universal-AMC minimum | 17 days |
| 2020 Universal-Cinemark, $50m+ opening | 31 days |
| 2021 Warner Bros. on HBO Max | 0 days |
| 2022 Warner Bros. to HBO Max | 45 days |
| 2024 top 100 films average | 34 days |
| 2025 top 100 films average | 37 days |
| 2026 Paramount pledge | 45 days |
| Date | Deal or measure | Window | Source |
|---|---|---|---|
| 2012 | Average home-release window, as stated by NATO | 112 days | NATO, via The Playlist |
| 2017 | Average home-release window, as stated by NATO | 85 days | NATO, via The Playlist |
| July 2020 | Universal and AMC: premium VOD allowed after three weekends, US only, AMC shares in PVOD revenue | 17 days | AMC press release |
| Nov 2020 | Universal and Cinemark: 17 days, or 31 days for films opening above $50m | 17 or 31 days | Axios |
| 2021 | Warner Bros. releases the whole US slate on HBO Max on opening day | 0 days | Hollywood Reporter |
| 2022 | Warner Bros. ends day-and-date; 45 days before HBO Max, under deals with Cineworld/Regal and AMC | 45 days | Next TV |
| 2024 | Average for the top 100 films (derived: Cinema United said 2025 was three days longer) | 34 days | Cinema United |
| 2025 | Average for the top 100 films | 37 days | Cinema United |
| 2025 | Average first TVOD window, wide releases (provisional); 36 days in 2024 | 39 days | Omdia, via Celluloid Junkie |
| 2025 | Disney average to first TVOD | 61.6 days | Omdia, via Celluloid Junkie |
| April 2026 | Paramount pledges 45 days in cinemas for every film, streaming after 90 days | 45 days | AP, via Spokesman-Review |
The direction since 2024 is towards longer windows again. Omdia found that all of 2025's top ten North American films waited at least 30 days before first TVOD, and the top ten averaged 51 days, up from 45 in 2024. It also found that fewer than half of the 17 studio titles that opened above $50 million in 2025 had a 45-day window (Omdia). Cinema United is lobbying for a 45-day minimum and says the 2025 top-100 average would have been 49 days if every title had had one (Cinema United).
For the cinema, a shorter window compresses a film's life. Most of the gross arrives in the first two or three weekends, holdovers earn less, and the opening weekend matters more. That changes marketing: a customer has to be told about a film before it opens, not three weeks in.
Day-and-date experiments: HBO Max and Disney Premier Access
The pandemic produced the only large-scale tests of day-and-date release, where a film opens in cinemas and at home on the same day.
Warner Bros. and HBO Max, 2021
Warner Bros. put its entire 2021 US slate, including Dune, Godzilla vs. Kong and The Suicide Squad, on HBO Max on the day it opened in cinemas. Outside the US the films opened in cinemas only. Trade coverage at the end of 2021 described the box office results as mixed (Hollywood Reporter). Warner Bros. abandoned the strategy from 1 January 2022 and agreed 45-day windows with Cineworld/Regal and AMC (Next TV).
Disney+ Premier Access and Black Widow, 2021
Disney released Black Widow in cinemas and on Disney+ Premier Access, at $29.99, on 9 July 2021. Disney reported $80 million of domestic box office on the opening weekend and $60 million of Premier Access consumer spending worldwide (TheWrap). Disney did not publish Premier Access figures after that weekend.
The second weekend fell about 67%, the steepest second-weekend drop for a Marvel Studios film at the time. NATO, now Cinema United, blamed the simultaneous release, arguing that piracy and home viewing had cut into the run (Screen Daily). The film finished with $183.7 million domestic and $379.8 million worldwide (Box Office Mojo). Pandemic-era audiences front-loaded many films, so the drop cannot be laid entirely at day-and-date's door. But the episode is the main reason studios moved back towards exclusive windows.
What the evidence says: does streaming cause the decline in cinema attendance?
Few independent studies isolate the effect of streaming on cinema attendance, and most of the widely quoted ones were paid for by exhibitors. Here is what exists, with who funded it.
| Study | Funded or run by | Main finding |
|---|---|---|
| Hennig-Thurau et al., Journal of Marketing, 2007 | Academic | Survey of 1,770 consumers in the US, Japan and Germany. Releasing in cinemas and on rental home video simultaneously would maximise studio revenue in the US but could cut theater revenue by about 40% (paper) (press release). |
| EY Quantitative Economics and Statistics, 2018 | NATO (exhibitors) | Survey of 2,500 people. Those who went to the cinema nine or more times a year streamed about 11 hours a week, against about 7 hours for those who went once or twice. Almost half of non-moviegoers did not stream at all (CBS). |
| EY, 2020 | NATO (exhibitors) | Longer windows raised total revenue: a film that waited 108 days for home release rather than 98 earned $1.75 million more, two-thirds of it at the box office (The Playlist). |
| The Numbers Business Report, April 2025 | Independent data firm | Premium VOD releases cost the domestic box office about $80 million to $130 million a year. Shorter windows generally did more harm; 18-day windows were an exception. Studios were not necessarily earning much more from short windows once lost box office was counted (The Numbers). |
| Omdia windowing analysis, 2026 | Independent research firm | Windows lengthened in 2025. Its surveyed US cinema-goers were heavy users of streaming too: 95% used SVOD (Celluloid Junkie). |
Put together, the evidence points one way. Streaming and cinema-going are complements for the most engaged film fans and substitutes for casual viewers of mid-range titles. The measurable damage to cinemas runs mainly through the window: the earlier a film is available at home, the less it earns in theaters. The Cinema Foundation's 2023 report adds a related point, that a longer exclusive period delays the spike in piracy that follows a home release (Cinema Foundation).
Two cautions. Survey studies show correlation, not cause: heavy film fans do everything more. And the industry-funded studies were published while the window was being negotiated, so read them as advocacy backed by data rather than neutral research.
Europe vs the US: cinema attendance recovery against 2019
If streaming were the main cause of the decline in cinema attendance, markets with similar streaming take-up would show similar declines. They do not. Europe had a record year in 2019, with more than 1.34 billion admissions, the highest since the early 1990s, at a time when streaming was growing fast (UNIC, via Boxoffice Pro).
Show the data as a table
| Market | 2025 vs 2019 |
|---|---|
| Germany | 77% |
| France | 73% |
| United Kingdom | 70% |
| Europe (UNIC) | 64% |
| United States | 63% |
| South Korea | 47% |
| Market | 2019 admissions | 2025 admissions | 2025 as % of 2019 |
|---|---|---|---|
| Germany | 118.6m (FFA) | 91.9m (FFA) | 77% |
| France | 213.3m (CNC) | 156.2m (CNC) | 73% |
| United Kingdom | 176.1m (BFI) | 123.5m (BFI) | 70% |
| Europe, UNIC territories | 1,340m (UNIC) | 863.6m (UNIC) | 64% |
| United States | 1,230m (The Numbers) | 769m (The Numbers) | 63% |
| South Korea | 226.7m (KOFIC) | 106.1m (KOFIC) | 47% |
Europe's 2019 total is UNIC's provisional figure and its 2025 total covers 39 territories, so treat that row as approximate. The spread is wide. Germany and France have kept far more of their audience than the US. France sets its windows by regulation, the chronologie des médias, which keeps films off home platforms for months rather than weeks, and it has a strong supply of local films. South Korea, one of the busiest cinema markets in the world in 2019, is at less than half of that level. More on the European picture is in our European cinema statistics and global box office pages.
The pattern is consistent with window length and local supply of films, not streaming subscriptions alone, being what separates markets that recovered from those that did not. That is an interpretation, not a proven cause: slates, prices and economies differ too.
Do movies make more money in theaters or streaming?
For the films that work in cinemas, the theatrical release still earns more, and it raises the value of every later window. Barbie (2023) grossed $636 million in the US and Canada and $1.45 billion worldwide (Box Office Mojo) before reaching home platforms. No streaming premiere has published revenue on that scale.
- Per transaction, home release can look better for the studio. On Black Widow's opening weekend, Disney reported $60 million of Premier Access spend against $80 million of domestic box office (TheWrap). A studio keeps only its film rental share of a ticket, but most of a home-rental fee. That is why day-and-date tempted studios.
- Over a whole run, it usually does not. Black Widow's second-weekend collapse shows the cost. The Numbers found studios were not clearly earning more from short windows once the lost box office was counted (The Numbers). Hennig-Thurau's study found simultaneous release helped the studio but at heavy cost to theaters (2007).
- Even Netflix has tested cinemas. A sing-along version of KPop Demon Hunters played about 1,700 North American cinemas over the weekend of 23 to 24 August 2025 and earned an estimated $18 million to $20 million. Netflix does not publish grosses, so that figure is an estimate (Screen Daily).
As a business, streaming is now larger: Netflix alone took $45.2bn in 2025 (10-K), against a global box office of about $33.6bn (Gower Street). For an individual film with broad appeal, though, a theatrical run is still the largest single source of revenue and the thing that makes it worth more on every platform afterwards.
Are movie theaters dying?
No, but they are smaller and more concentrated than in 2019. The data:
- Audience reach is still broad. 77% of Americans aged 12 to 74, more than 200 million people, saw at least one film in a cinema in the year to August 2025, according to NRG research cited by Cinema United (Cinema United).
- Frequent moviegoers are growing. The number seeing six or more films a year rose 8%, and Gen Z averaged 6.1 visits, up from 4.9 (Cinema United).
- Screens have shrunk only slightly. The US had about 38,400 screens at the end of 2023 against a peak of 41,172 in 2019 (Cinema United), a fall of about 7%. Our screen count research and closures and openings tracker have the detail.
- Owners are still investing. Cinema United says North American theater owners spent more than $1.5 billion on upgrades in the year to late 2025 (Cinema United).
- But attendance has not come back. 769 million tickets in 2025 is 37% below 2019, and revenue is being held up by price rather than by visits.
The cinemas under most pressure are those that depended on ordinary weeknight shows of mid-range films, the slot streaming took. Those doing well tend to sell an occasion: premium formats, food and drink, events and a loyal regular audience.
The theater experience: what still drives attendance
Event films and premium formats
The clearest signal is in premium large format. IMAX took a record $1.28 billion at the global box office in 2025, 13% above its previous record in 2019, and a record 3.8% share of global box office. Its US and Canada gross was $449 million (IMAX), about 5% of the domestic total. Audiences who do go out are choosing the version of the film that is hardest to reproduce at home. See premium large format for how branded and house PLFs work.
Watching with a crowd
Shared viewing is something a sofa cannot supply. The KPop Demon Hunters sing-along, a film already free to Netflix subscribers, sold out screens because the audience wanted to sing together. Horror, comedy, anime and concert films work the same way. The same NRG data cited by Cinema United shows the youngest audiences going more often, and a McKinsey dataset it quotes ranks immersive experiences and distinctive food as Gen Z's top priorities (Cinema United).
A night out
Cinema competes with restaurants and live events as much as with streaming. The rooms that hold their price sell the evening: reserved recliners, food and drink, and a programme worth planning a night around.
| What still drives attendance | Evidence |
|---|---|
| Event and franchise films | Fewer releases (670 in 2025 vs 910 in 2019) carry most of the gross (Box Office Mojo) |
| Premium large format | IMAX 2025 record, 13% above 2019 (IMAX) |
| Frequent, younger moviegoers | Gen Z 6.1 visits a year, habitual moviegoers up 8% (Cinema United) |
| Loyalty and subscription | New loyalty subscriptions up 15% in North America, 2024 to 2025 (Cinema United) |
| Longer exclusive windows | Top-100 average up from 34 to 37 days, 2024 to 2025 (Cinema United) |
Strategies for movie theaters: what operators can do
A cinema cannot change the window or the slate. It can change who knows about its programme, how often they come and what they spend. Five actions follow from the data above.
1. Sell the occasion, not the access
The audience can get most films at home within about five weeks. What it cannot get is the screen, the sound and the crowd. Name your premium rooms and explain them on the film page and at seat selection, programme events (Q&As, double bills, sing-alongs, anime nights) and treat a day-and-date title as an event with fewer, better screenings.
2. Build frequency with loyalty and membership
The growth is in frequency among people who already come, so the most valuable asset is knowing who they are. Loyalty subscriptions grew 15% in North America between 2024 and 2025 (Cinema United). See movie loyalty programs explained and dynamic pricing for the pricing side.
3. Market before opening weekend
With a 30 to 45 day window, word of mouth has little time to work. Tell the people who came to the last three similar films about this one before it opens, through your own email, app and push notifications rather than paid reach alone.
4. Programme for the films streaming left behind
Streaming took the mid-range weeknight film, but there is still an audience for repertory, local-language films, documentaries and community screenings, especially where the multiplex down the road does not show them. These also tend to have looser terms. Our guide to film programming covers the basics.
5. Measure admissions, not just gross
National gross is up because prices are up. Track your own admissions, occupancy and spend per head separately, and compare your admissions with the national trend rather than with zero.
Worked examples
Example 1: what the national trend means for one site. A cinema that sold 100,000 tickets in 2019 at the national average of $9.16 took $916,000 at the box office. If it had followed the national trend, it would sell 100,000 × 0.626 = 62,600 tickets in 2025. At $11.31 that is 62,600 × $11.31 = $708,000, down 22.7%. To get back to $916,000 at today's price it needs $916,000 ÷ $11.31 = about 81,000 tickets: 18,400 more a year, or 29% more than the trend level.
Example 2: what frequency is worth. Suppose 3,000 loyalty members each visit four times a year: 12,000 admissions. One extra visit each adds 3,000 admissions. At $11.31 that is $33,930 of box office, before food and drink. At an illustrative spend per head of $6, it is another $18,000. Use your own ticket price and spend per head; these numbers are only to show the arithmetic.
The screening break-even calculator and movie theater profit calculator let you run the same sums with your own figures. For how the money flows, see how movie theaters make money.
Movie theaters that are doing well
The operators that have held up best share a model: they sell an evening out, not just a seat.
Alamo Drafthouse Cinema

Alamo built its brand on dine-in service at the seat, a strict no-talking, no-texting policy, and events and themed screenings alongside new releases. Sony Pictures bought the chain in June 2024, when it had 35 locations in 25 metro areas, and placed it in a new division, Sony Pictures Experiences (Boxoffice Pro). A studio buying a cinema chain is itself a statement about where it thinks the value of theatrical lies.
iPic Theaters
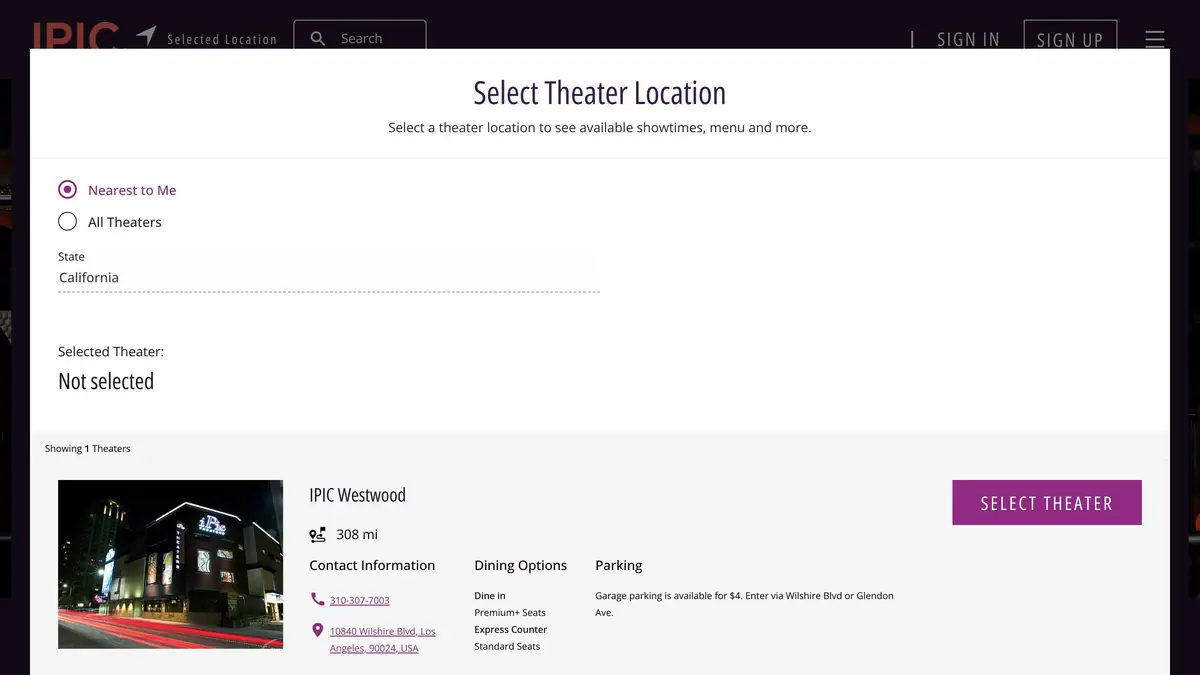
iPic is the premium end of the dine-in model: small rooms of recliners, food served during the film and prices well above a standard ticket.
Cinépolis USA

The US arm of the Mexican circuit uses luxury auditoriums with recliners and in-seat service as its main point of difference.
None of these is a template for every site, but each sells a reason to leave the house.
Conclusion: what the impact of streaming means for your cinema
Streaming did not empty cinemas on its own. US attendance slid slowly for 17 years while streaming grew, then fell sharply in 2020 and has recovered to about 63% of 2019. The lasting damage runs through shorter windows and the loss of mid-range films, and the industry is now pushing windows back towards 45 days. Event films, premium formats and frequent regulars are carrying the business.
For an operator, the response is practical: sell the occasion, know your regulars, market before opening day, and measure admissions as well as gross. Running your own website, app and loyalty programme is part of that, because it is the channel that reaches your regulars before a three-to-five-week window closes. That is what Filmgrail builds for cinemas, including loyalty, at a flat price per screen.
Sources and method
US attendance and ticket prices are from The Numbers (archived January 2026); The Numbers revises earlier years, so figures can differ slightly from older reports. US and Canada box office is Box Office Mojo's release-year domestic gross in nominal dollars. Netflix memberships are year-end paid memberships from its annual reports on Form 10-K; the 2013 to 2015 totals add domestic and international streaming members. Window figures mix different measures (average home-release window, deal minimums, top-100 averages and first-TVOD averages); each is labelled. Europe vs US recovery divides each market's 2025 admissions by its 2019 admissions, using each country's official body. Percentages are rounded.
- The Numbers, Movie Market Summary (archived 24 January 2026)
- Box Office Mojo, domestic yearly box office
- Netflix Form 10-K filings: 2015, 2018, 2020, 2022, 2024, 2025
- BetaNews: Netflix to stop reporting subscriber numbers (April 2024)
- AMC and Universal press release, 28 July 2020
- Axios: Cinemark and Universal deal, 16 November 2020
- Hollywood Reporter: WarnerMedia's Project Popcorn results
- Next TV: HBO Max day-and-date releases to end in 2022
- Boxoffice Pro: Cinema United State of the Industry, CinemaCon 2026
- Celluloid Junkie: Omdia windows analysis, 18 June 2026
- AP via Spokesman-Review: Paramount 45-day pledge, 16 April 2026
- The Playlist: EY study for NATO on windows, April 2020
- CBS News: EY study for NATO on streaming and moviegoing, 2018
- Hennig-Thurau et al., The Last Picture Show? Journal of Marketing, 2007 and press release
- The Numbers Business Report: short windows cost theaters about $100 million a year, 9 April 2025
- TheWrap: Black Widow opening and Premier Access, July 2021, Screen Daily: NATO on Black Widow, Box Office Mojo: Black Widow
- Box Office Mojo: Barbie
- Screen Daily: KPop Demon Hunters sing-along, August 2025
- Gower Street Analytics: 2025 global box office
- UNIC 2019 admissions, via Boxoffice Pro and UNIC 2025 results, February 2026
- BFI statistics 2019 and BFI official statistics 2025
- CNC 2019 attendance and CNC Bilan 2025
- FFA Kinojahr 2019 and FFA 2025 results
- KOFIC 2019 admissions, via Manila Bulletin and KOFIC 2025
- IMAX: record $1.28 billion in 2025, 7 January 2026
- Cinema United: Strength of Theatrical Exhibition, 2025 update
- Cinema United (then NATO): number of US movie screens
- Boxoffice Pro: Sony acquires Alamo Drafthouse, June 2024
- The Cinema Foundation: State of the Cinema Industry, March 2023

Cinema technology since 2011: built his first cinema aggregator that year, pivoted to building cinema software in 2016, and pioneered native cinema apps that reached ~4× the market benchmark for weekly use. Now applying AI to cinema operations. More about John.